Measuring monetary policy: rules versus discretion
In this paper, we propose a novel method to measure the strength of commitment versus discretion in monetary policy. We estimate a Taylor-type monetary policy rule with time-varying heteroskedasticity, decomposing the policy into rule-based and discretionary components. Deviations from the committed rule, in form of volatility of a policy shock, are linked to macroeconomic variables, disclosing the nature and strength of discretion of a central banker. We estimate our model for the period 1967–2005 focusing on the determinants of volatility of policy shocks in the USA. The proposed heteroskedastic model provides a better fit to the data than the standard Taylor rule. Inflation has positive significant effects on volatility of shocks in the full sample, pre-Volcker, and Volcker periods, while during the Greenspan era, the degree of discretion is decreasing in headline inflation, but increasing in core inflation. We also find significant positive association between stock market volatility and policy discretion, but no relationship between the shock volatility and output gap.
This is a preview of subscription content, log in via an institution to check access.
Access this article
Subscribe and save
Springer+ Basic
€32.70 /Month
- Get 10 units per month
- Download Article/Chapter or eBook
- 1 Unit = 1 Article or 1 Chapter
- Cancel anytime
Buy Now
Price includes VAT (France)
Instant access to the full article PDF.
Rent this article via DeepDyve
Fiscal rules and volatility: the role of stabilising properties and compliance
Article 17 August 2021
The Lucas hypothesis on monetary shocks: evidence from a GARCH-in-mean model
Article 29 June 2017
The Macroeconomic Effects of the Federal Reserve’s Conventional and Unconventional Monetary Policies
Article 10 June 2024
Notes
For analytical derivation of policy rules under discretion and commitment, see Clarida et al. (1999) and Clarida et al. (2000).
In the literature, “monetary policy shock” is often referred to as an unanticipated monetary policy action. In this paper, we refer to monetary policy shocks as deviations from the policy rule.
For the early literature, see Clarida et al. (2000), Orphanides (2004) and the references therein.
Friedman (2006) concludes that the era may stand as the modern day pinnacle of “discretion” rather than “rule.”
Orphanides (2003) shows that the systematic component of the monetary policy in the Greenspan era was not much different from earlier times. Kahn (2012) analyzed the transcripts of Federal Open Market Committee (FOMC) during this period and found a large number of references by committee members to monetary policy rules. On the contrary, Blinder and Reis (2005) conclude that “Federal Reserve policy under his chairmanship has been characterized by the exercise of pure, period-by-period discretion, with minimal strategic constraints of any kind, maximal tactical flexibility at all times, and not much in the way of explanation.” (p.14).
In the pre-Volcker period 1967Q1–1979Q2, the Fed-Reserve had been chaired by William Martin, 1951–1970; Arthur Burns, 1970–1978; and William Miller, 1978–1979.
Although Greenbook projections are available for a longer period, we use data up to 2005Q4 in order to exclude effects of possible structural changes in the rule resulting from Ben Bernanke’s appointment as the chairman of the Federal Reserve, as well as the effects of the Great Recession and unconventional monetary policy measures implemented after 2008.
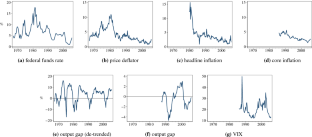
The core measure of inflation excludes food and energy prices from the price index.
We obtain data on VIX index from the FRED database of the Federal Reserve Bank of St. Louis.
Choice of timing of variables is motivated in the next section.
The null hypothesis that the mean difference is equal to zero is rejected at 1% significance level with P-value = 0.003.
The correlation coefficients are 0.81 between \( \pi _^c \) and \( \pi _^h \) , 0.80 between \( \pi _^h \) and \( \pi _^d \) , 0.89 between \( \pi _^c \) and \( \pi _^d \) .
The correlation between the measures of output gap \( x_ \) and \( x_^ \) is 0.43.
See Enders (2015), p.70.
We discuss alternative specifications with additional regressors in the mean equation in the Robustness section.
References
- Agnello L, Sousa RM (2014) The determinants of the volatility of fiscal policy discretion. Fiscal Stud 35(1):91–115. https://doi.org/10.1111/j.1475-5890.2014.12024.xArticleGoogle Scholar
- Ang A, Dong S, Piazzesi M (2007) No-arbitrage Taylor rules. NBER Working Papers 13448, National Bureau of Economic Research, Inc
- Ang A, Boivin J, Dong S, Loo-Kung R (2011) Monetary policy shifts and the term structure. Rev Econ Stud 78(2):429–457 ArticleGoogle Scholar
- Ball LM (1999) Policy Rules for Open Economies. In: Monetary policy rules, NBER Chapters, National Bureau of Economic Research, Inc, pp 127–156, https://ideas.repec.org/h/nbr/nberch/7415.html
- Barro RJ, Gordon DB (1983) A positive theory of monetary policy in a natural rate model. J Political Econ 91(4):589–610 ArticleGoogle Scholar
- Bikbov R, Chernov M (2010) No-arbitrage macroeconomic determinants of the yield curve. J Econom 159(1):166–182 ArticleGoogle Scholar
- Blanchard O, Simon J (2001) The long and large decline in U.S. output volatility. Brookings Papers Econ Activity 32(1):135–174
- Blinder AS, Reis R (2005) Understanding the Greenspan standard. Proceedings - Economic Policy Symposium - Jackson Hole (Aug):11–96, https://ideas.repec.org/a/fip/fedkpr/y2005iaugp11-96.html
- Bodenstein M, Erceg CJ, Guerrieri L (2008) Optimal monetary policy with distinct core and headline inflation rates. J Monet Econ 55:S18–S33 ArticleGoogle Scholar
- Boivin J (2006) Has U.S. monetary policy changed? evidence from drifting coefficients and real-time data. J Money Credit Bank 38(5):1149–1173 ArticleGoogle Scholar
- Bollerslev T (1986) Generalized autoregressive conditional heteroskedasticity. J Econom 31(3):307–327 ArticleGoogle Scholar
- Bunzel H, Enders W (2010) The taylor rule and “opportunistic” monetary policy. J Money Credit Bank 42(5):931–949 ArticleGoogle Scholar
- Cerqueiro G, Degryse H, Ongena S (2011) Rules versus discretion in loan rate setting. J Financ Intermed 20(4):503–529 Google Scholar
- Clarida R, Galí J, Gertler M (1998) Monetary policy rules in practice Some international evidence. Eur Econ Rev 42(6):1033–1067 ArticleGoogle Scholar
- Clarida R, Galí J, Gertler M (1999) The science of monetary policy: a new Keynesian Perspective. J Econ Lit 37(4):1661–1707 ArticleGoogle Scholar
- Clarida R, Galí J, Gertler M (2000) Monetary policy rules and macroeconomic stability: evidence and some theory. Q J Econ 115(1):147–180 ArticleGoogle Scholar
- Coroneo L, Corradi V, Santos Monteiro P (2013) Testing for optimal monetary policy via moment inequalities. Working Paper 985, University of Warwick, Department of Economics, https://ideas.repec.org/p/wrk/warwec/985.html
- Cukierman A, Muscatelli V (2008) Nonlinear taylor rules and asymmetric preferences in central banking: evidence from the united kingdom and the united states. J Macroecon 8(1):1–31 Google Scholar
- Dennis R (2004) Inferring policy objectives from economic outcomes. Oxford Bull Econ Stat 66:735–764. https://doi.org/10.1111/j.1468-0084.2004.100_1.xArticleGoogle Scholar
- Dolado J, María-Dolores R, Ruge-Murcia F (2004) Nonlinear monetary policy rules: some new evidence for the U.S. studies. Nonlinear Dyn Econom 8(3):1–34
- Dolado J, María-Dolores R, Naveira M (2005) Are monetary-policy reaction functions asymmetric?: the role of nonlinearity in the phillips curve. Eur Econ Rev 49(2):485–503 ArticleGoogle Scholar
- Enders W (2015) Applied econometric time series, 4th edn. Wiley, Hoboken Google Scholar
- Engle R (1982) Autoregressive conditional heteroscedasticity with estimates of the variance of United Kingdom inflation. Econometrica 50(4):987–1007 ArticleGoogle Scholar
- Favero CA, Rovelli R (2003) Macroeconomic stability and the preferences of the Fed: A formal analysis, 1961-96. J Money Credit Banking 35(4):545–56
- Fendel R, Frenkel M, Rulke JC (2011) “Ex-ante” Taylor rules and expectation forming in emerging markets. J Comp Econ 39(2):230–244 ArticleGoogle Scholar
- Friedman BM (2006) The Greenspan Era: discretion, rather than rules. Am Econ Rev 96(2):174–177 ArticleGoogle Scholar
- Gerlach S (2000) Asymmetric policy reactions and inflation. Bank for International Settlements. Unpublished manuscript
- Givens GE (2012) Estimating central bank preferences under commitment and discretion. J Money Credit Bank 44(6):1033–1061. https://doi.org/10.1111/j.1538-4616.2012.00522.xArticleGoogle Scholar
- Hayat A, Mishra S (2010) Federal reserve monetary policy and the non-linearity of the taylor rule. Econ Model 27(5):1292–1301 ArticleGoogle Scholar
- Kahn GA (2012) The Taylor Rule and the Practice of Central Banking. In: Koenig EF, Leeson R, Kahn GA (eds) The Taylor Rule and the Transformation of Monetary Policy, Book Chapters, Hoover Institution, Stanford University, chap 3, https://ideas.repec.org/h/hoo/bookch/4-3.html
- Klose J (2011) Asymmetric taylor reaction functions of the ecb: an approach depending on the state of the economy. North Am J Econ Finance 22(2):149–163 ArticleGoogle Scholar
- Kydland FE, Prescott EC (1977) Rules rather than discretion: the inconsistency of optimal plans. J Polit Econ 85(3):473–91 ArticleGoogle Scholar
- Mishkin FS (2007) Headline versus core inflation in the conduct of monetary policy. Presentation given at the Business Cycles, International Transmission and Macroeconomic Policies Conference, HEC Montreal
- Nikolsko-Rzhevskyy A, Papell DH, Prodan R (2014) Deviations from rules-based policy and their effects. J Econ Dyn Control 49:4–17 ArticleGoogle Scholar
- Orphanides A (2001) Monetary policy rules based on real-time data. Am Econ Rev 91(4):964–985 ArticleGoogle Scholar
- Orphanides A (2003) Historical monetary policy analysis and the Taylor rule. J Monetary Econ 50(5):983–1022 ArticleGoogle Scholar
- Orphanides A (2004) Monetary policy rules, macroeconomic stability, and inflation: a view from the trenches. J Money Credit Bank 36(2):151–75 ArticleGoogle Scholar
- Ozlale U (2003) Price stability vs. output stability: tales of federal reserve administrations. J Econ Dyn Control 27(9):1595–1610
- Ruge-Murciá FJ (2002) A Prudent Central Banker. IMF Staff Papers 49(3):1–7, https://ideas.repec.org/a/pal/imfstp/v49y2002i3p7.html
- Salemi MK (2006) Econometric policy evaluation and inverse control. J Money Credit Bank 38(7):1737–1764 ArticleGoogle Scholar
- Sims CA, Zha T (2006) Were there regime switches in U.S. monetary policy? Am Econ Rev 96(1):54–81 ArticleGoogle Scholar
- Soderstrom U, Soderlind P, Vredin A (2005) New-Keynesian models and monetary policy: a re-examination of the stylized facts. Scand J Econ 107(3):521–546. https://doi.org/10.1111/j.1467-9442.2005.00421.xArticleGoogle Scholar
- Sun W, De K (2019) Real exchange rate, monetary policy, and the U.S. economy: evidence from a FAVAR model. Econ Inquiry 57(1):552–568 ArticleGoogle Scholar
- Svensson LEO (2000) Open-economy inflation targeting. J Int Econ 50(1):155–183 ArticleGoogle Scholar
- Svensson LEO (2003) What is wrong with Taylor rules? using judgment in monetary policy through targeting rules. J Econ Lit 41(2):426–477 ArticleGoogle Scholar
- Svensson LEO (2005) Monetary policy with judgment: forecast targeting. Int J Central Bank 1(1), https://ideas.repec.org/a/ijc/ijcjou/y2005q2a1.html
- Taylor JB (1993) Discretion versus policy rules in practice. Carnegie–Rochester Conference Series on Public Policy 39(1):195–214
- Taylor JB (1999) The robustness and efficiency of monetary policy rules as guidelines for interest rate setting by the European central bank. J Monet Econ 43(3):655–679 ArticleGoogle Scholar
- Taylor JB (2001) The role of the exchange rate in monetary-policy rules. Am Econ Rev 91(2):263–267 ArticleGoogle Scholar
- Taylor JB (2005) Commentary : understanding the Greenspan standard. Proceedings - Economic Policy Symposium - Jackson Hole (Aug):107–118, https://ideas.repec.org/a/fip/fedkpr/y2005iaugp107-118.html
- Taylor JB (2012) Monetary policy rules work and discretion doesn’t: a tale of two eras. J Money Credit Bank 44(6):1017–1032. https://doi.org/10.1111/j.1538-4616.2012.00521.xArticleGoogle Scholar
- Taylor JB, Williams JC (2010) Simple and robust rules for monetary policy. Handbook Monet Econ 3:829–859 ArticleGoogle Scholar
- White H (1982) Maximum likelihood estimation of misspecified models. Econometrica 50(1):1–25 ArticleGoogle Scholar
Acknowledgements
We thank Jordi Galí, Christian Brownlees, the Editor of the Journal, two anonymous Referees, and participants of Armenian Economic Association’s 2016 Annual Meeting for helpful comments and suggestions.
Author information
Authors and Affiliations
- Department of Economics and Business, Universitat Pompeu Fabra, 25-27, Ramon Trias Fargas, 08005, Barcelona, Spain Narek Ohanyan
- American University of Armenia, 40, Baghramyan Ave., 0019, Yerevan, Armenia Aleksandr Grigoryan
- Narek Ohanyan
